
You Downloaded Apni Prerna. Now What?
So your child has an Apna PC, and you’ve heard about this app called Apni Prerna that tracks their learning activity. Maybe the school recommended it. Maybe you saw it mentioned on the website. Either way, you installed it, opened the dashboard, and thought: “What am I looking at?”
You’re not alone. Most parents feel the same way the first time. The dashboard has charts, numbers, and categories that seem a bit overwhelming if nobody explains what they mean.
This guide is going to fix that. By the time you’re done reading, you’ll know exactly what every section of the Apni Prerna dashboard tells you and how to use it to actually help your child learn better.
The Activity Overview: What Your Child Is Actually Doing
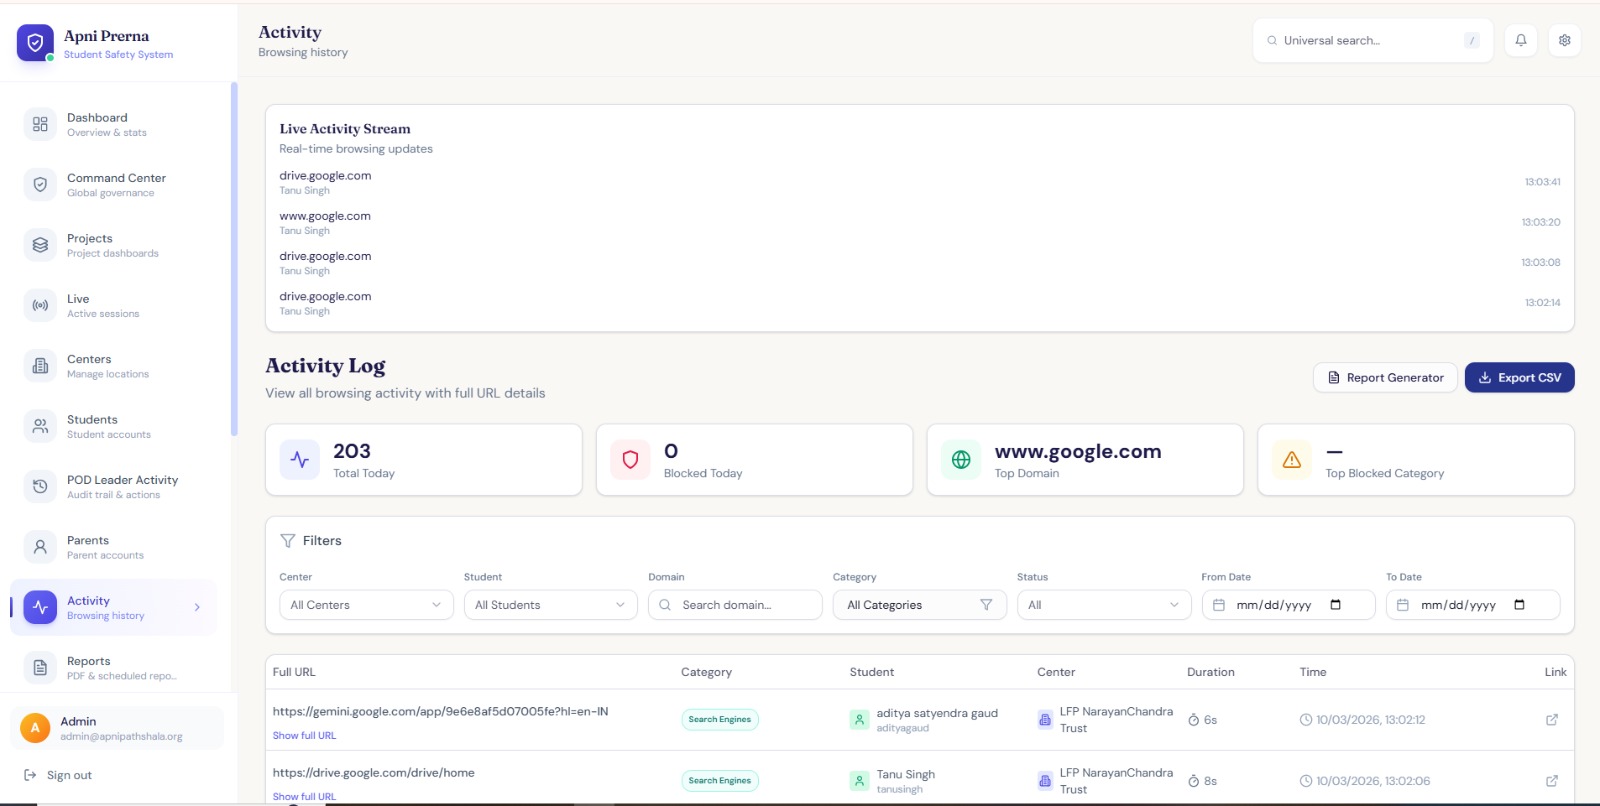
The first thing you’ll see on the dashboard is an activity overview. This shows you a breakdown of what applications your child used, how long they spent on each one, and when they were most active.
Think of it like a report card, but for computer usage. Except instead of grades from a teacher, you’re seeing actual behavior.
If your child spent two hours on LibreOffice and thirty minutes on a browser, you know they were probably working on assignments. If they spent three hours in the browser and ten minutes on everything else? That might need a conversation.
Don’t Panic Over Every Number
Here’s an important thing to remember. Not every browsing session is wasted time. Your child might be researching a project, watching educational videos, or reading articles for school. The dashboard shows you what they used, but you need context to understand why.
The goal isn’t to micromanage every minute. It’s to spot patterns over days and weeks. Is your child consistently spending more time on learning tools? Great. Are they gradually shifting toward entertainment only? Time to step in gently.
According to UNICEF’s digital parenting guidelines, the most effective approach is collaborative. Look at the data with your child, not as a weapon, but as a conversation starter.
The Learning Progress Section
Below the activity overview, you’ll find a section that tracks learning progress across different tools. This is where things get genuinely useful.
Apni Prerna categorizes computer time into productive and recreational usage. Educational apps, document creation, and research browsing fall under productive. Games and entertainment fall under recreational.
The dashboard shows you the ratio over time. A healthy pattern looks like mostly productive during weekdays with more flexibility on weekends. If the ratio is flipped, you know something needs adjusting.
Weekly Trends Tell the Real Story
Daily data can be misleading. Maybe your child had a bad day and didn’t study at all. That’s normal. What you want to look at is the weekly trend. Is the overall direction positive? Are they spending more time on educational activities this week compared to last?
NCERT recommends regular monitoring of student engagement outside the classroom. Apni Prerna gives you exactly that without needing to stand over your child’s shoulder.
Screen Time Reports: How Much Is Too Much?
The screen time section shows total hours per day and per week. You’ll see a simple graph that makes it easy to spot when usage spikes or drops.
Here’s the thing about screen time, though. It’s not just about quantity. Two hours of coding practice is completely different from two hours of scrolling memes. The distinction between active and passive screen time matters way more than the total number.
Use the screen time report alongside the activity breakdown. If total screen time is high, but most of it is on educational tools? Don’t stress. If it’s high and mostly entertainment? That’s your signal.
Using the Dashboard for Parent-Teacher Conversations
This is a feature most parents don’t take advantage of, but should. Before a parent-teacher meeting, pull up the weekly summary from Apni Prerna. You can show the teacher exactly what your child has been working on at home.
Instead of the usual “he studies at home” or “she doesn’t study enough,” you have actual data. “My son spent 8 hours on educational apps this week, mostly LibreOffice and the browser for research.” That’s a much more productive conversation.
Better conversations lead to better support for your child. That’s the whole point.
The Bottom Line
Apni Prerna isn’t a spying tool. It’s a parenting tool. The dashboard gives you visibility into something that was previously invisible: how your child actually uses their computer when you’re not watching.
Read it regularly. Discuss it with your child. Use it to celebrate good habits and gently redirect bad ones. That’s all it takes to turn data into better learning outcomes.
And if you’re still confused about any section, don’t hesitate to explore the dashboard with your child. They’ll probably figure out the charts faster than you do. That’s not a problem. That’s the whole point. Learning together is always better than monitoring alone.